Grafana
For improving the data visualization capabilities of Decidim, we have a working dashboard that can be imported to Grafana, an open-source observability and monitoring platform that allows users to visualize metrics, logs, and traces in real time from various data sources.
Initial set-up
The steps for having this dashboard are the following. For this tutorial we will use Grafana Cloud
-
Go to http://grafana.com
-
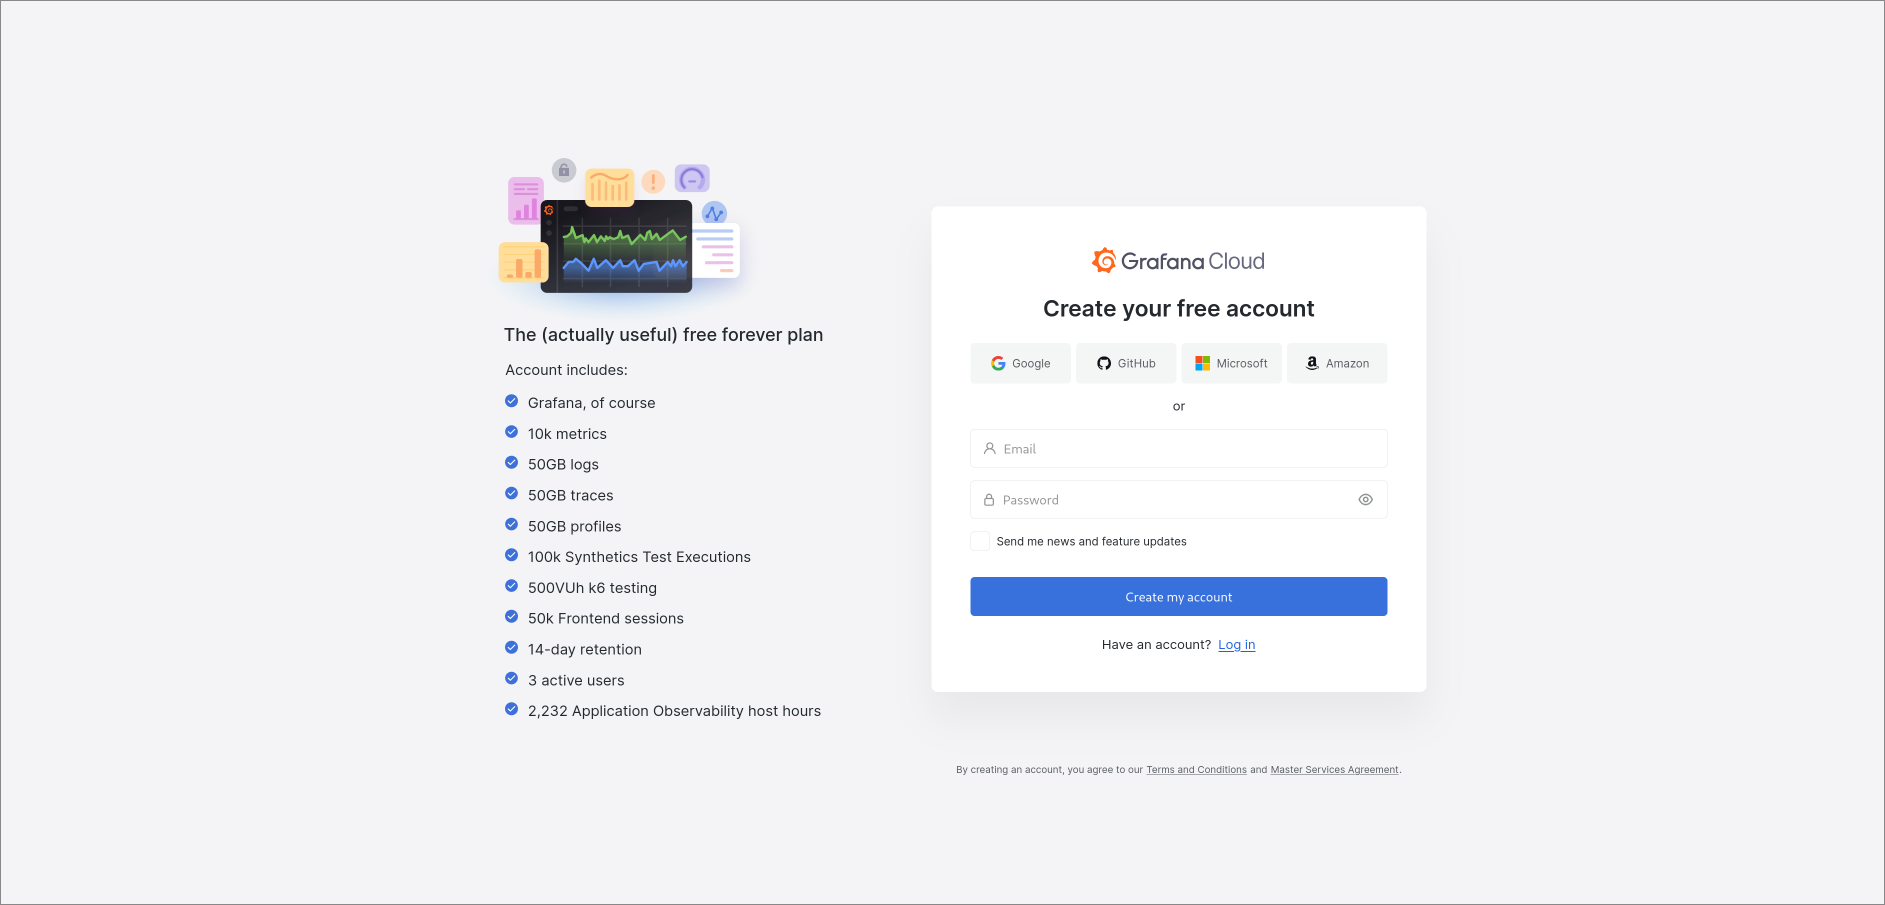
Click in button "Create account"
-
Fill the account creation form with your information
-
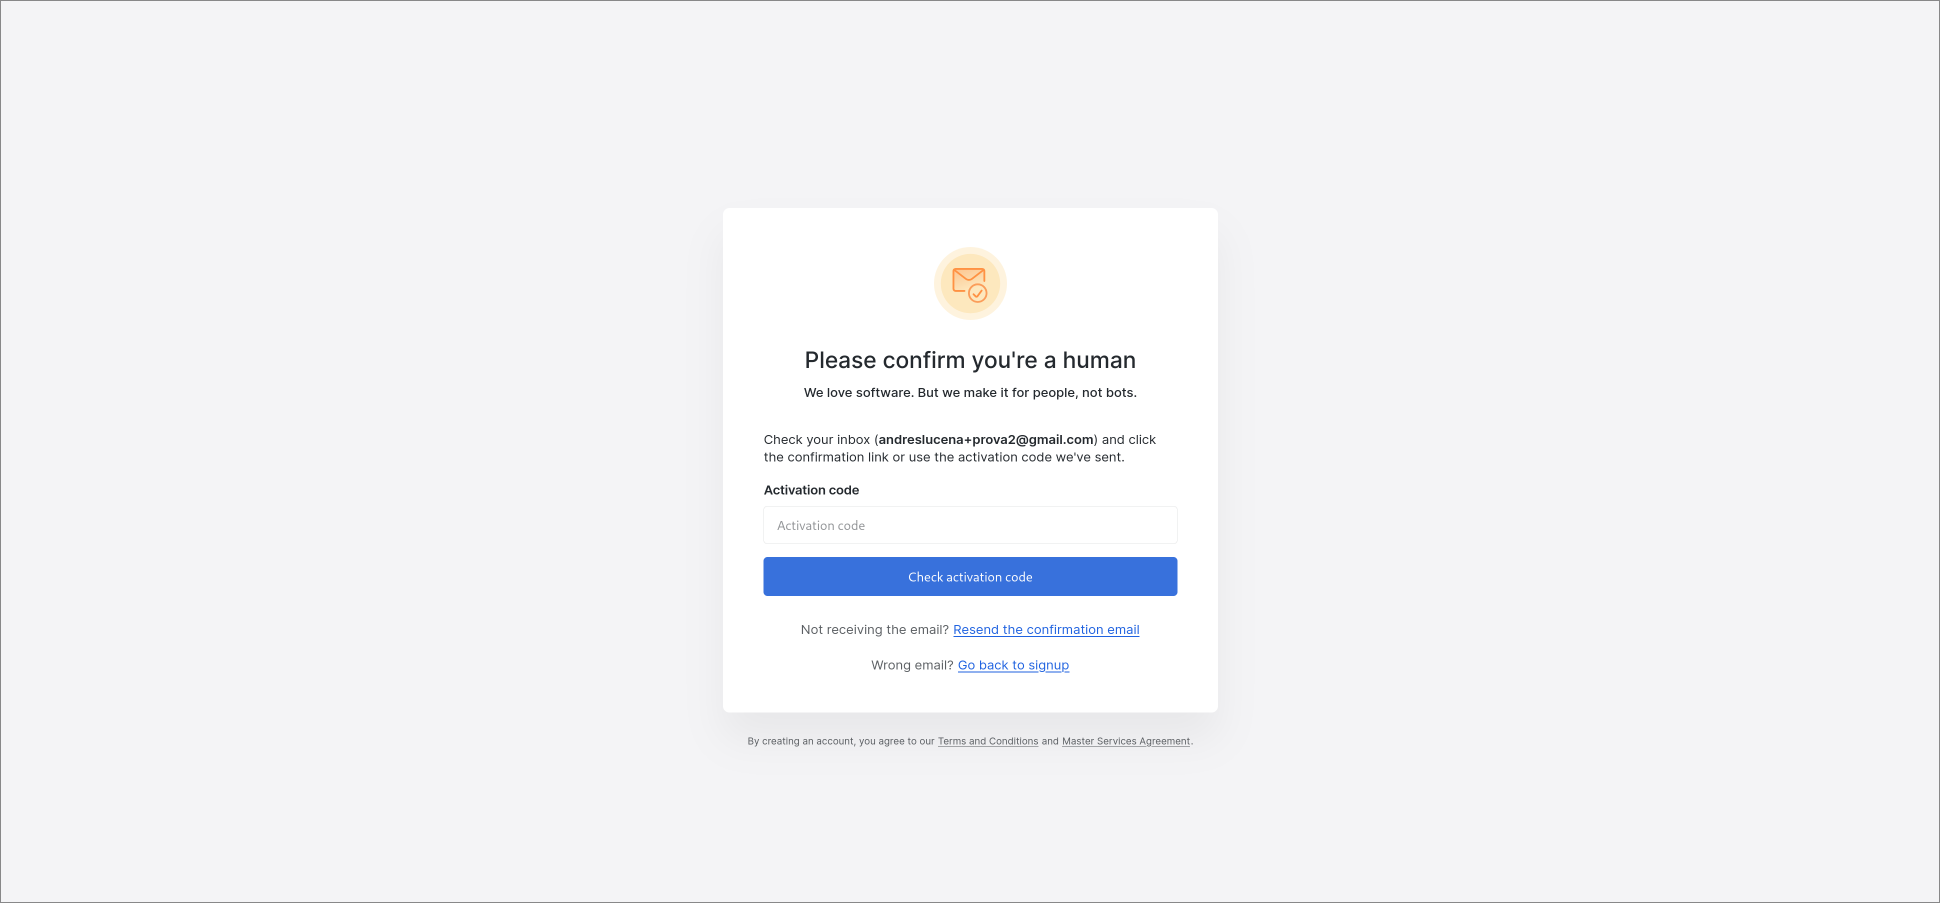
Confirm your email address
-
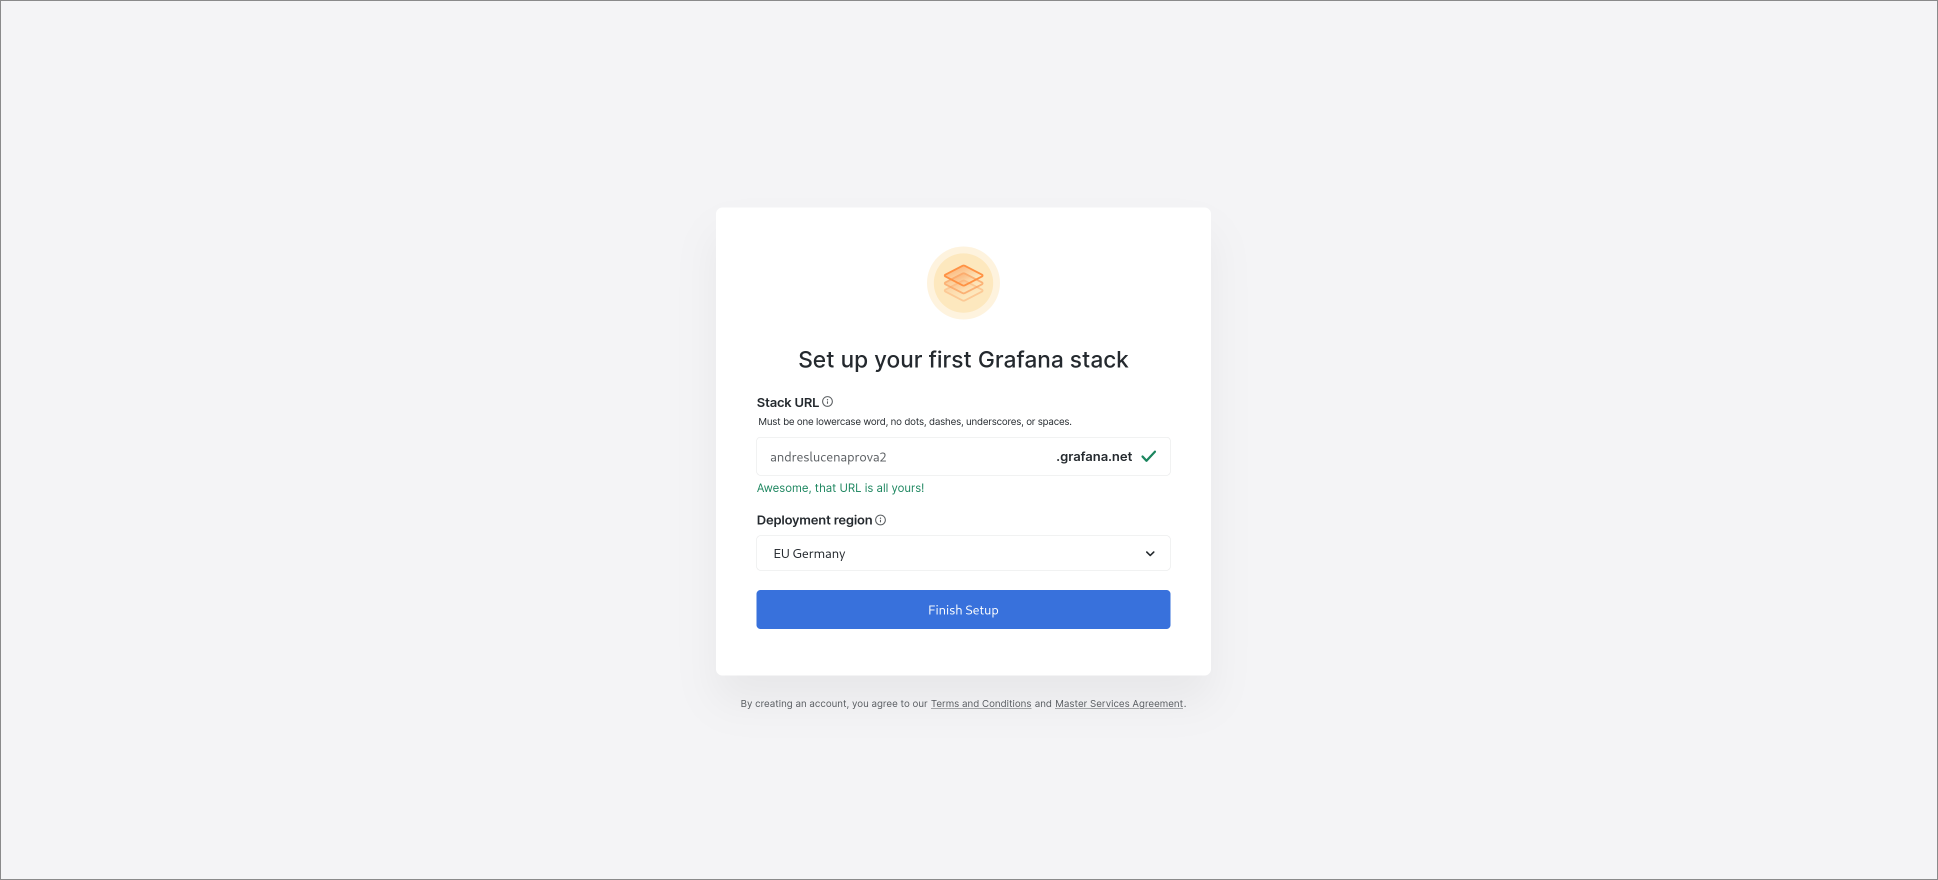
Finish the setup account process
Methods
Then, you have two options for connecting to any Decidim instance.
-
CSV (Comma-Separated Values): A simple file format used to store tabular data, such as spreadsheets or databases. Each line in a CSV file represents a row, with values separated by commas or other separators (semi colons in the case of Decidim).
-
GraphQL: A query language for APIs and a runtime for executing those queries. It allows clients to request only the data they need, reducing over-fetching and improving performance.
For demonstration purposes, we will use the Metadecidim installation.
| CSV | GraphQL |
|---|---|
Using the Open Data features from https://meta.decidim.org/open-data |
Using the GraphQL API features from https://meta.decidim.org/api |
Only has access to the last 24 hours data |
Has real-time access |
Has access to all the public data |
Has a limit on the number of resources. See Pagination of API responses |
So, taking into account the last limitation from the Grafana Infinity GraphQL connector, we recommend using the CSV method if you need to access more than the last 10 or 20 resources.
Examples
As a starting point to check-out the possibilities of this integration, we have provided some examples with the two methods.
CSV example
Download the example for CSV integrationGraphQL example
Download the example for GraphQL integrationImport
For importing any of these methods, follow these instructions:
-
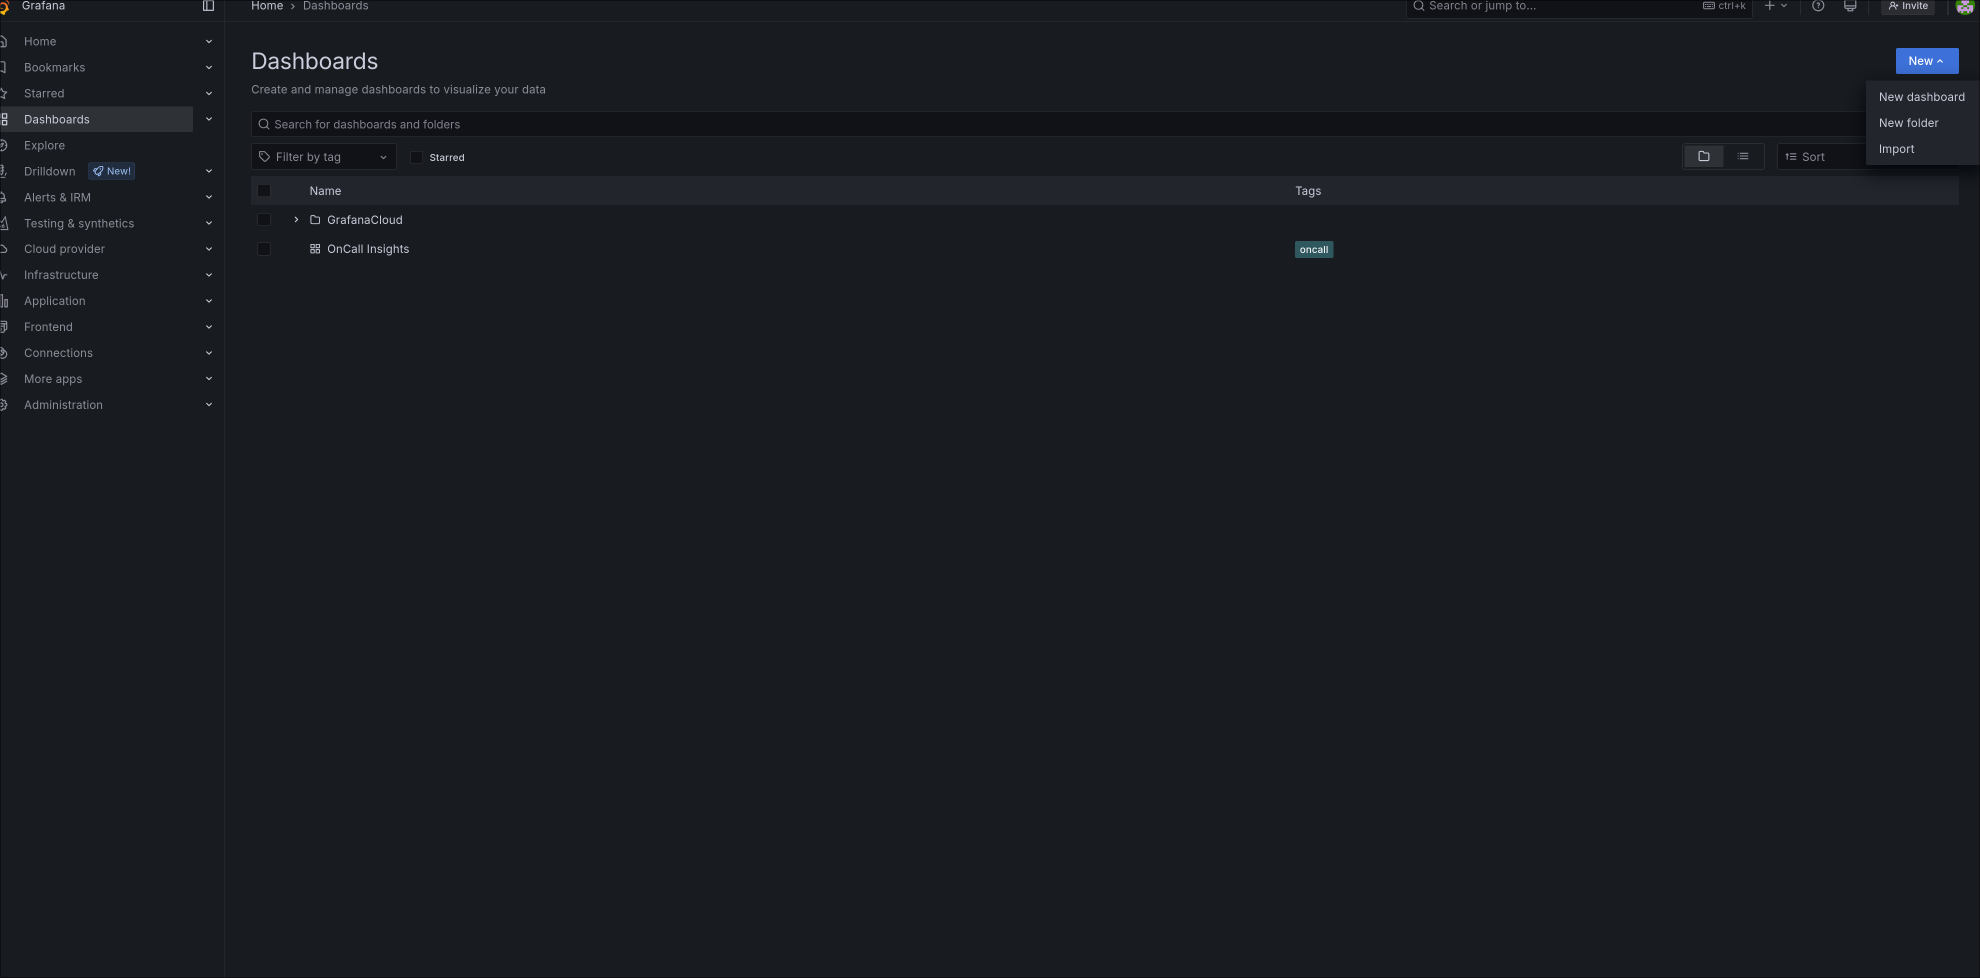
Go to the "Dashboards" page and in the "New" button click in the "Import" option
-
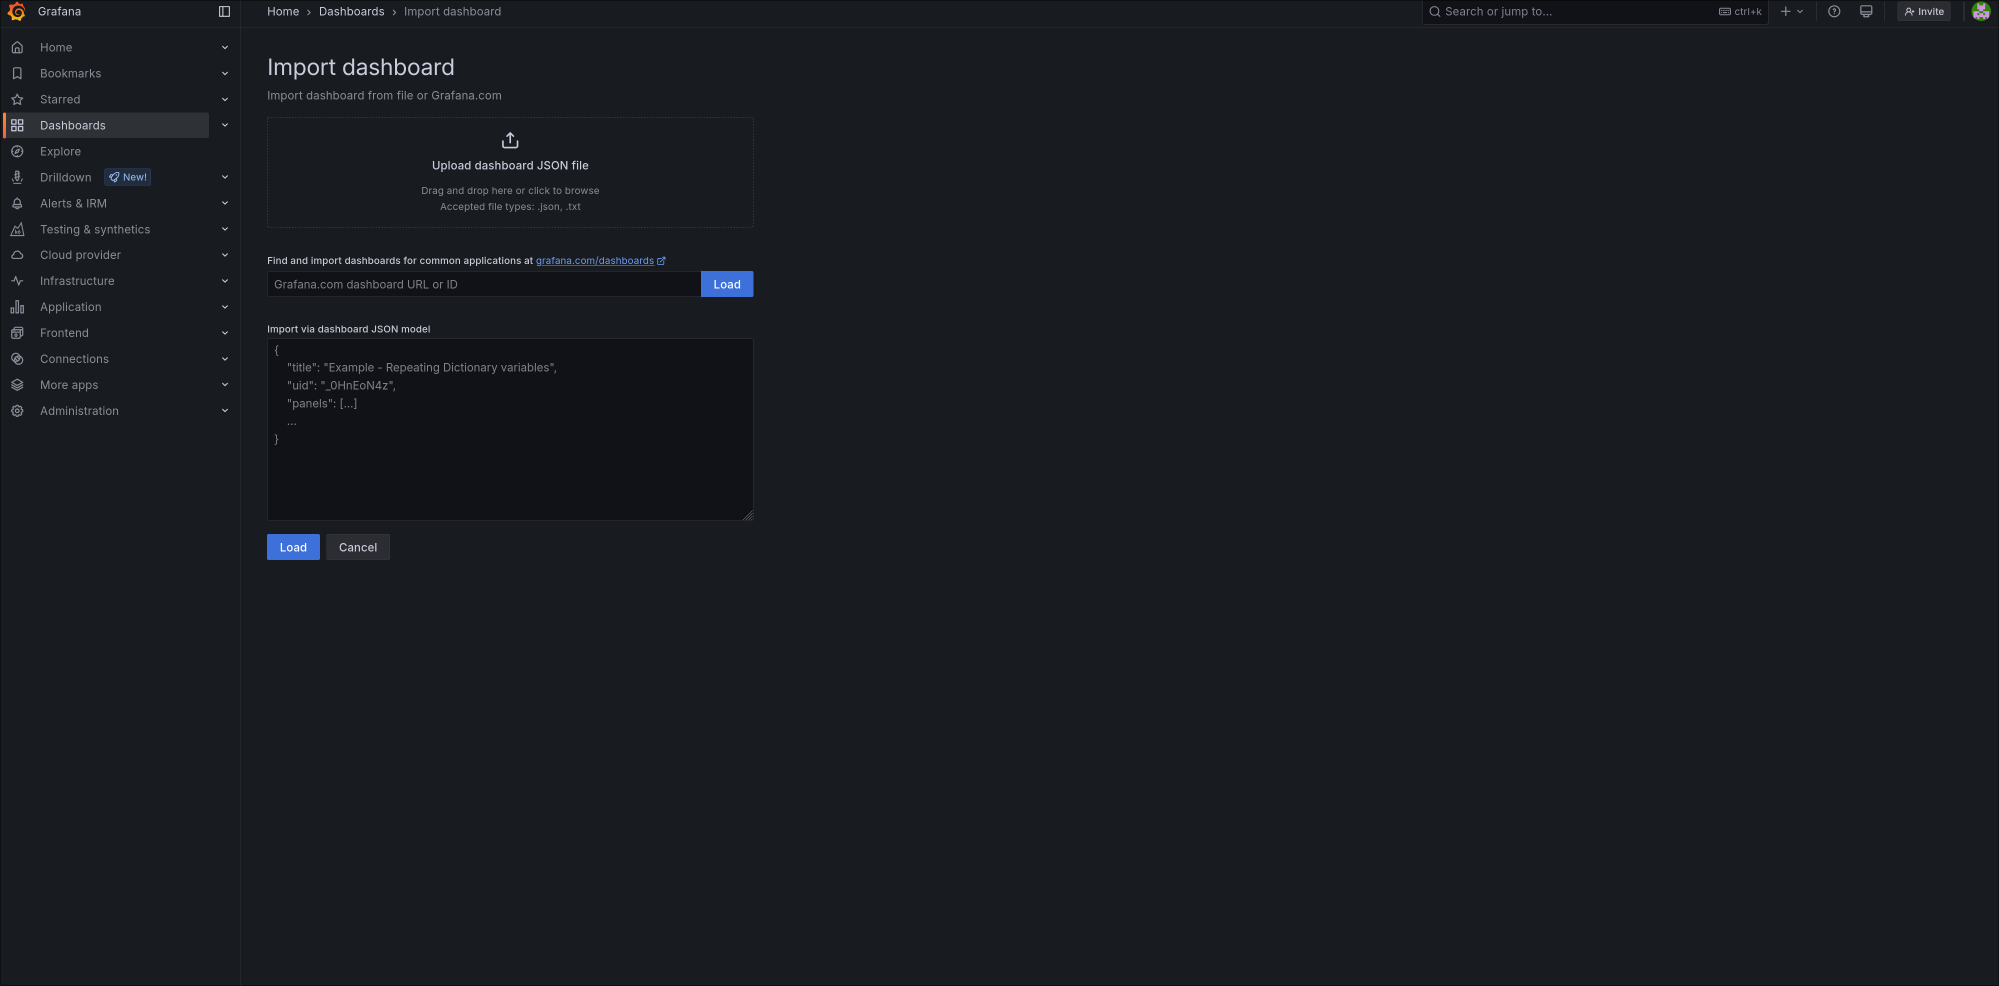
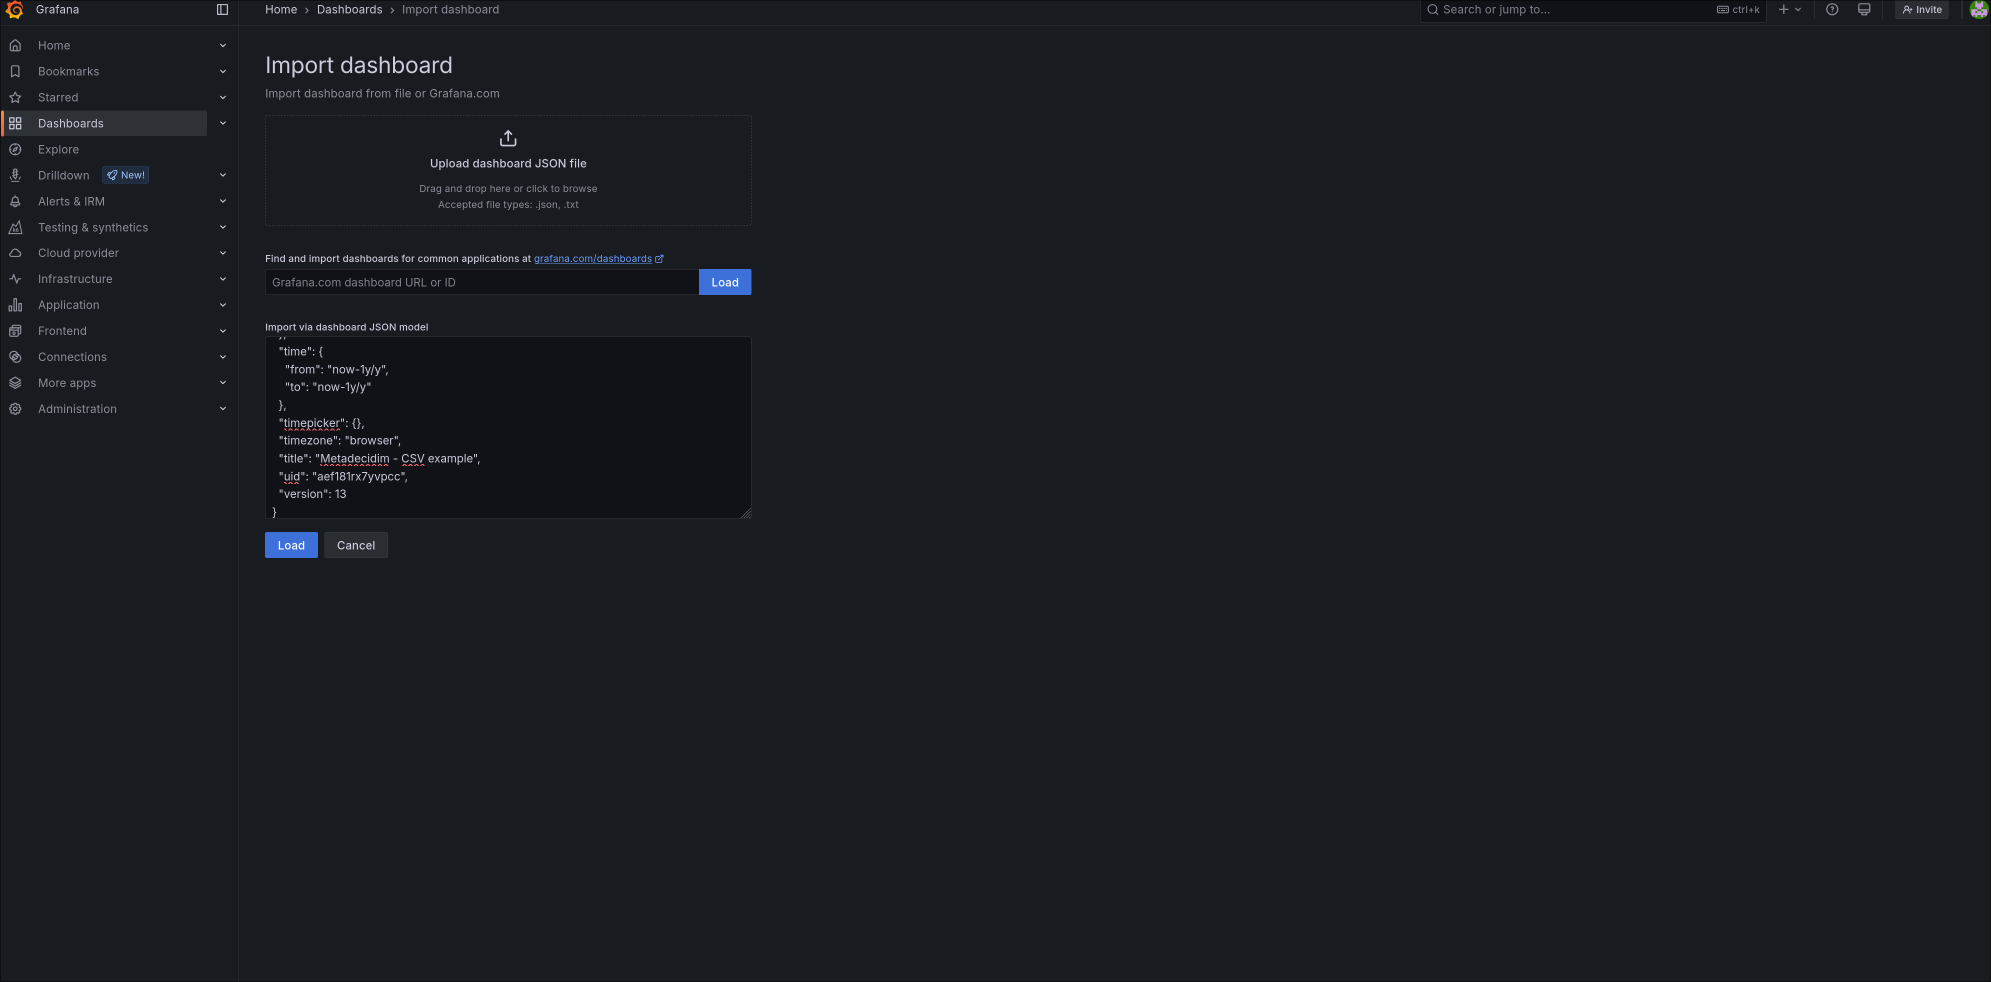
In the text area, paste the contents of any of the examples provided (see below).
-
Click in the "Import" button
-
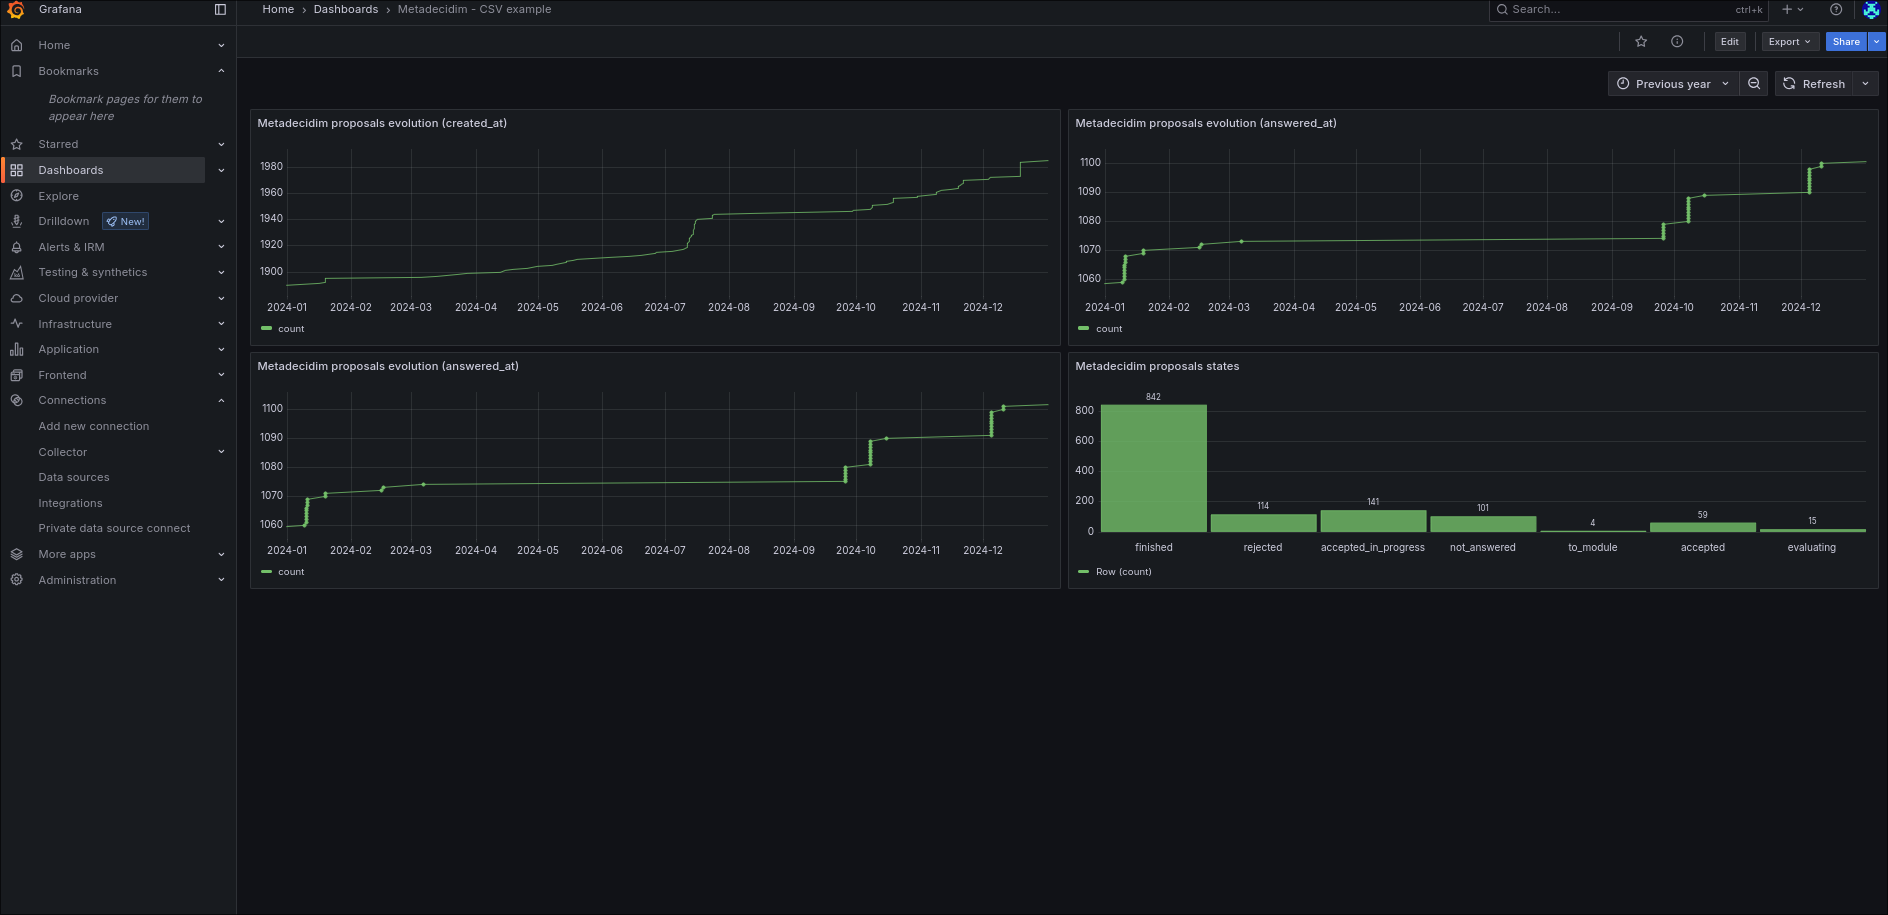
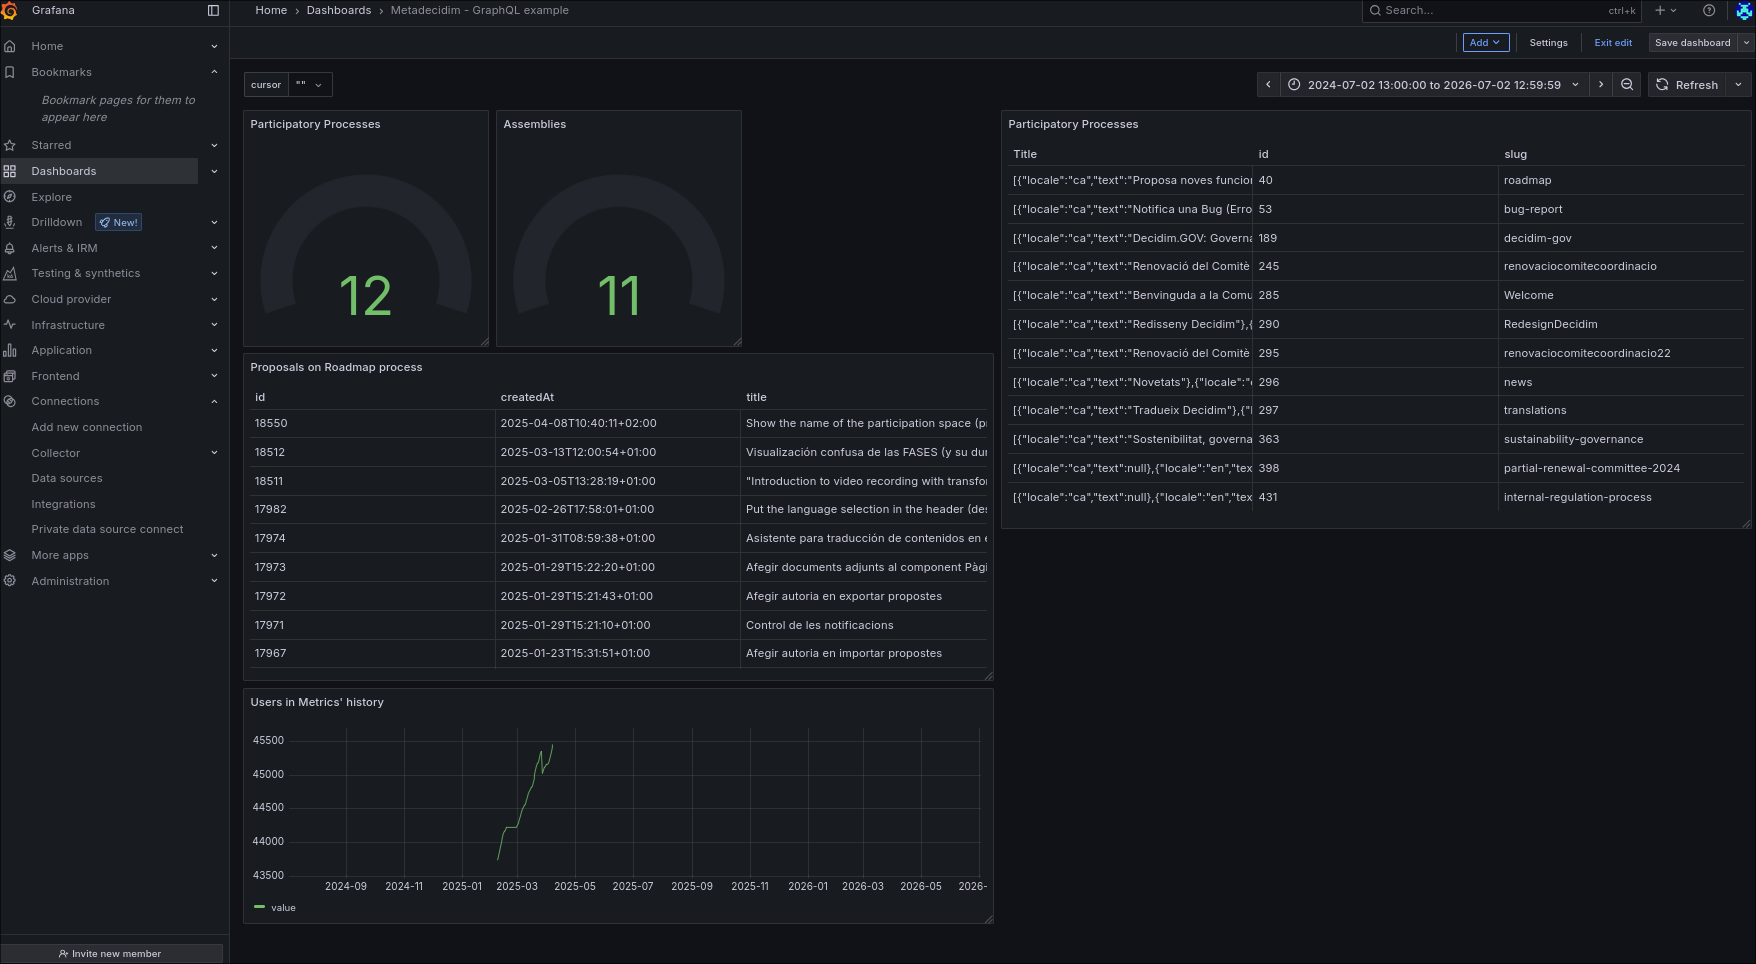
Then you will see the imported Dashboard. Even though the examples are based on Metadecidim, are a good starting point to understand how to connect any Decidim API with Grafana.
😊⌨️✨Happy hacking!